PLG Funnel Analytics
PLG Funnel Analytics
Project overview
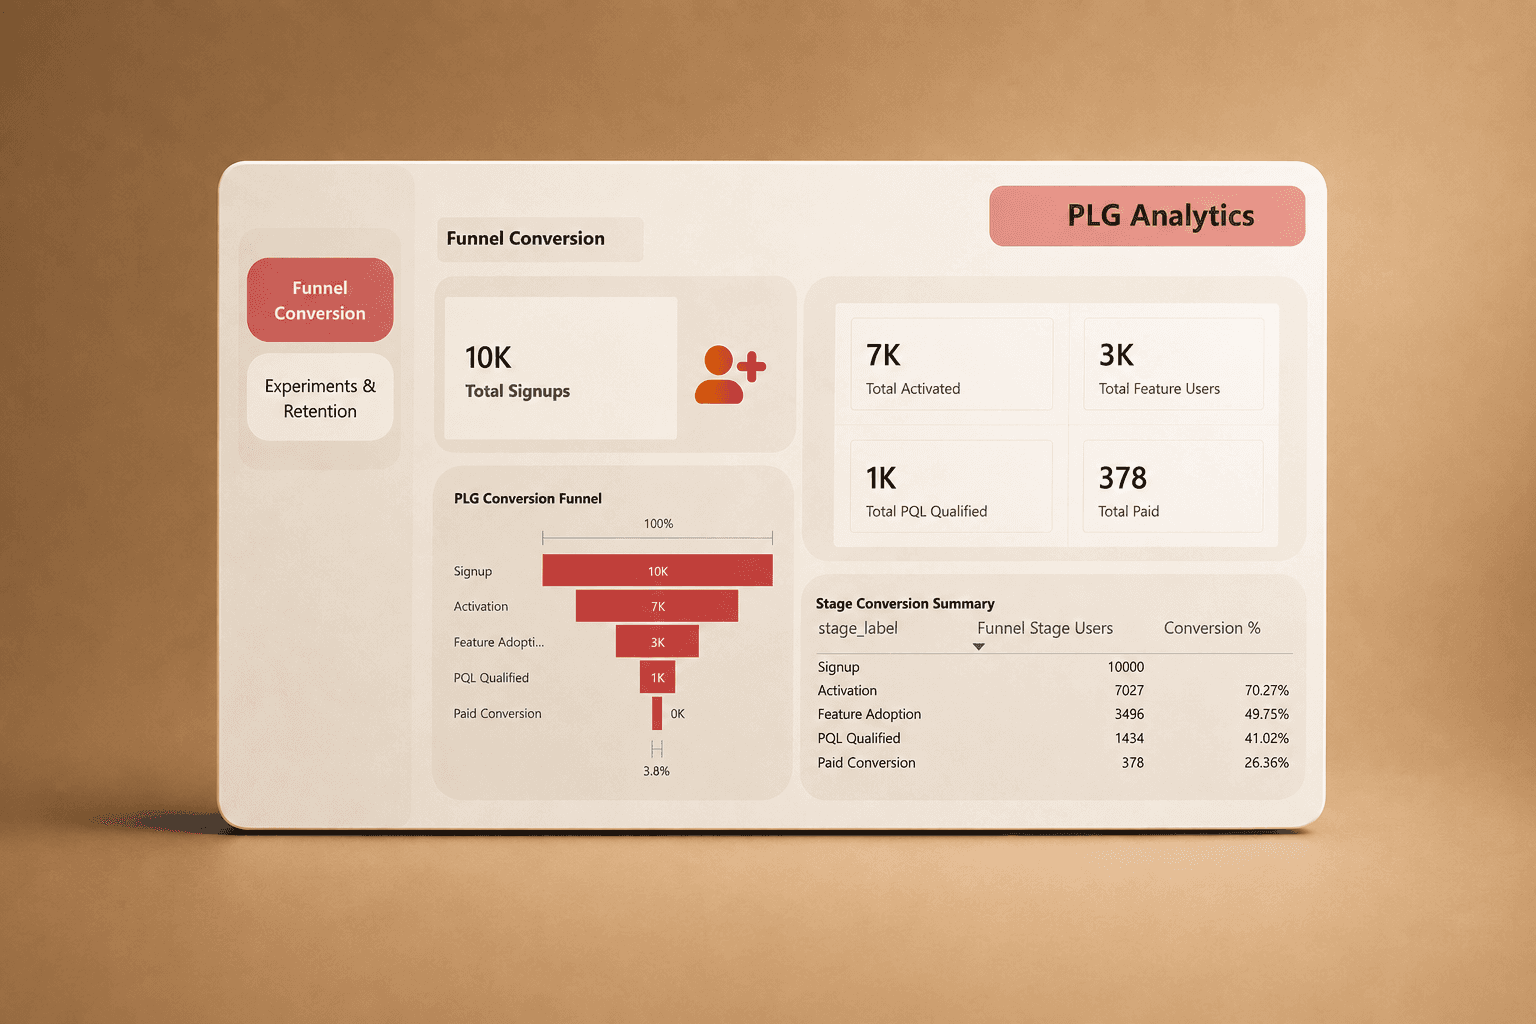
Built a Product-Led Growth (PLG) analytics solution to track user progression from signup to paid conversion. The analysis identified funnel bottlenecks, evaluated A/B test performance, and measured cohort retention using SQL, DAX, Python, and Power BI.
Built a Product-Led Growth (PLG) analytics solution to track user progression from signup to paid conversion. The analysis identified funnel bottlenecks, evaluated A/B test performance, and measured cohort retention using SQL, DAX, Python, and Power BI.


Challenge
SaaS teams need to understand where users drop off across the product journey and which stages have the greatest impact on conversion. The challenge was to transform user-event, experimentation, and cohort data into a structured analytics model that could accurately measure funnel conversion, A/B test performance, and retention.
SaaS teams need to understand where users drop off across the product journey and which stages have the greatest impact on conversion. The challenge was to transform user-event, experimentation, and cohort data into a structured analytics model that could accurately measure funnel conversion, A/B test performance, and retention.

Outcome
Developed a reproducible PLG analytics framework covering 10K users, 22K+ funnel events, and 24K A/B test assignments. The analysis identified a 49.75% Activation-to-Feature Adoption progression as the primary mid-funnel bottleneck, while A/B testing and cohort analysis provided additional insight into product engagement and retention.
Developed a reproducible PLG analytics framework covering 10K users, 22K+ funnel events, and 24K A/B test assignments. The analysis identified a 49.75% Activation-to-Feature Adoption progression as the primary mid-funnel bottleneck, while A/B testing and cohort analysis provided additional insight into product engagement and retention.


View more work.


