PLG Funnel Analytics
PLG Funnel Analytics
Problem & Architecture Overview
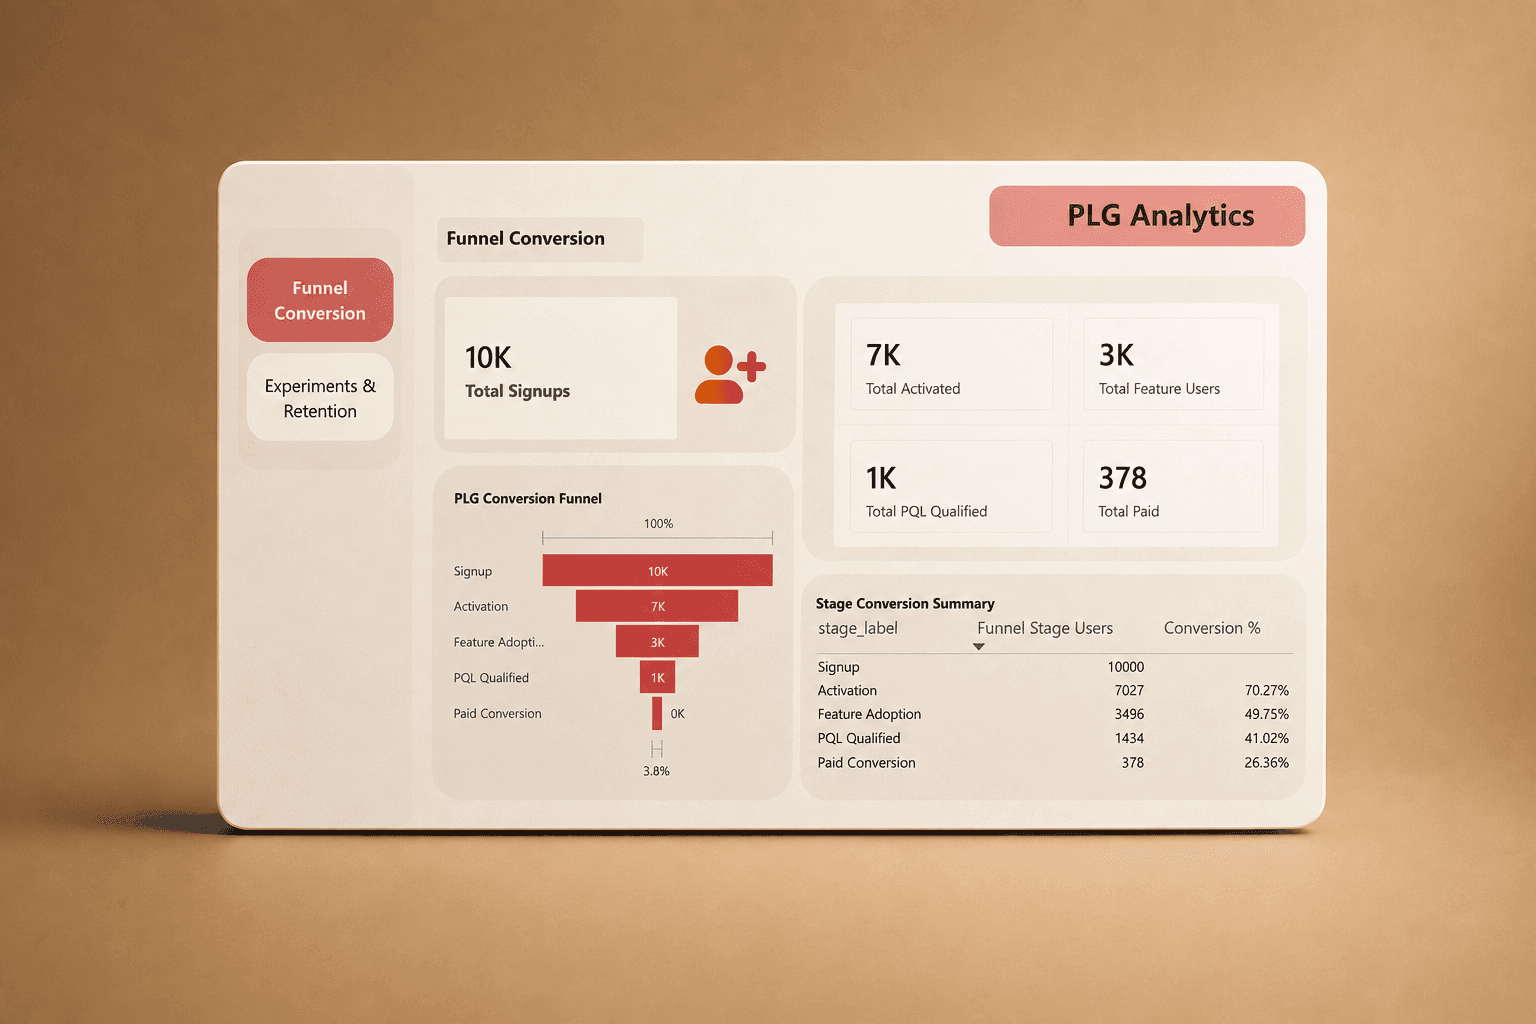
PLG Funnel Analytics is a product-led growth analytics system for measuring user progression from signup to paid conversion. SQL, Python, DAX, and Power BI model funnel events, A/B assignments, and cohorts to identify conversion bottlenecks and retention patterns.
PLG Funnel Analytics is a product-led growth analytics system for measuring user progression from signup to paid conversion. SQL, Python, DAX, and Power BI model funnel events, A/B assignments, and cohorts to identify conversion bottlenecks and retention patterns.
Services
Product & Funnel Analytics
BI Dashboards
Industry
SaaS / Technology
Year
2025
View GitHub Repository


Data Pipeline Design & Ingestion Flow
Product and growth teams needed reliable visibility into where users dropped off across activation, feature adoption, and paid conversion. The architecture consolidates event-level data into repeatable analytical models for funnel progression, experiment performance, and cohort retention.
Product and growth teams needed reliable visibility into where users dropped off across activation, feature adoption, and paid conversion. The architecture consolidates event-level data into repeatable analytical models for funnel progression, experiment performance, and cohort retention.

Failure Handling & Idempotency
The analytics model uses stable user and event identifiers to avoid double-counting across repeated refreshes. Validation steps reconcile stage counts, cohort windows, and experiment assignments so funnel metrics remain consistent between SQL outputs and Power BI reporting.
The analytics model uses stable user and event identifiers to avoid double-counting across repeated refreshes. Validation steps reconcile stage counts, cohort windows, and experiment assignments so funnel metrics remain consistent between SQL outputs and Power BI reporting.
Business & Operational Impact
The analysis identified Activation-to-Feature Adoption as the primary mid-funnel gap and gave stakeholders a repeatable framework for evaluating product growth. Dashboards translate raw events into decision-ready conversion, retention, and experiment metrics.
The analysis identified Activation-to-Feature Adoption as the primary mid-funnel gap and gave stakeholders a repeatable framework for evaluating product growth. Dashboards translate raw events into decision-ready conversion, retention, and experiment metrics.


View more work.


